How Dashboards Are Revolutionizing Analytics
One of the most significant ways dashboards are revolutionizing analytics is by providing real-time data. In the past, data analysis often involved time-consuming processes of data collection and manual reporting. Dashboards, however, can integrate with live data sources, ensuring that the information displayed is always up-to-date.
A dashboard without a clear purpose is like a ship without a compass. Defining the primary objective of the dashboard will guide every design decision you make.
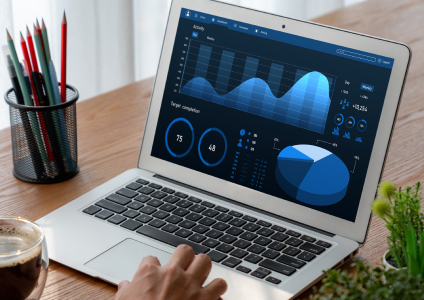
Enhanced Data Visualization
Dashboards excel in data visualization, making complex data sets easier to understand through graphs, charts, and other visual tools. This visual representation is much more accessible than raw data, which can be overwhelming and difficult to interpret.
Improved Accessibility and Collaboration
Dashboards can be accessed from anywhere, anytime, thanks to cloud technology. This accessibility ensures that stakeholders across the organization have the information they need at their fingertips, facilitating better collaboration and unified decision-making.


User-Friendly and Intuitive Design
Dashboards are truly revolutionizing analytics by making data more accessible, understandable, and actionable. They provide real-time insights, enhance data visualization, improve accessibility and collaboration, and offer customizable interfaces tailored to user needs. By integrating data from multiple sources and incorporating predictive analytics, dashboards empower businesses to make smarter, data-driven decisions. As technology continues to advance, the role of dashboards in analytics will only become more integral, driving innovation and efficiency in every sector.